What’s Next for USD/JPY, GBP/JPY, and GBP/USD After BOE and BOJ Rate Decisions?
The recent rate decisions from the Bank of England (BOE) and the Bank of Japan (BOJ) have left traders wondering about the future of USD/JPY, GBP/JPY, and GBP/USD. Let’s explore the latest developments:
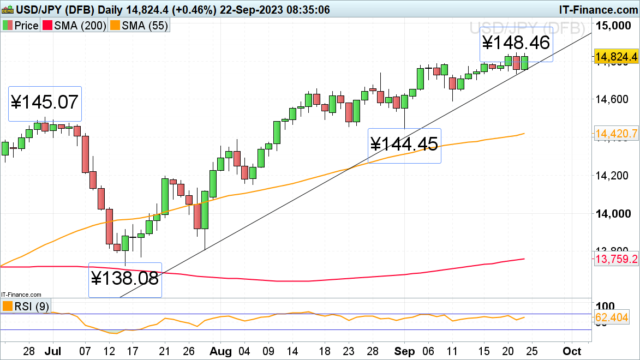
USD/JPY Pushes Toward Its 10-Month High
USD/JPY has been on a relentless climb, driven by the US dollar’s impressive streak of ten consecutive weeks of gains. The Federal Reserve’s (Fed) hawkish pause has fueled this ascent, while the BOJ has maintained its dovish stance, holding its short-term interest rate at -0.1% and the 10-year bond yields around 0% in its recent monetary policy meeting.
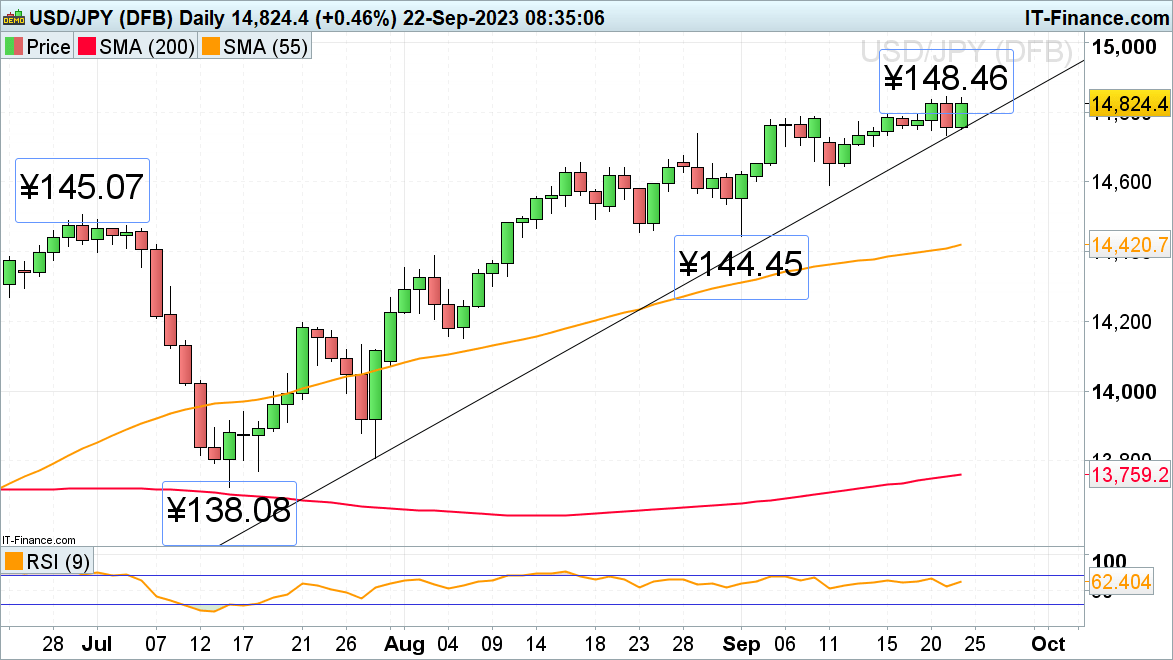
USD/JPY is now nearing its 10-month high at ¥148.46, reached just last Thursday. A breakout beyond this level could bring the ¥150.00 region into focus, a point at which the BOJ may consider intervention.
Immediate bullish pressure persists as long as USD/JPY remains above its July-to-September uptrend line at ¥147.51 and holds above Thursday’s low of ¥147.33. As long as this support area holds, the uptrend from July to September remains intact.


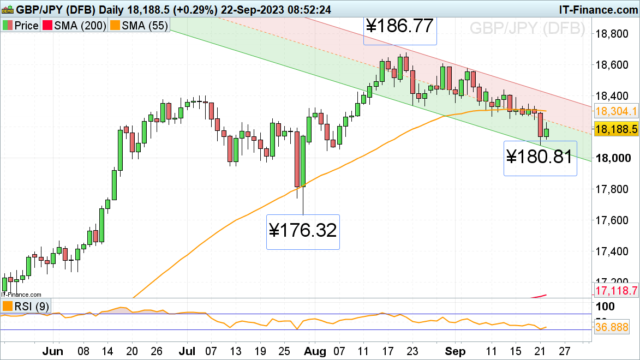
GBP/JPY Seeks to Recover from Six-Week Lows
GBP/JPY faced downward pressure as the BOE opted to keep its rates unchanged, resulting in a six-week low at ¥180.81, approaching the August low at ¥180.46.
However, the cross is attempting to rebound from the ¥180.81 low, following the BOJ’s decision to maintain its rates and reaffirm its dovish stance. In addition, Japan’s annual inflation rate dipped to 3.2% in August, its lowest level in three months.
Key resistance levels can be found between the mid-September low at ¥182.52 and the 55-day simple moving average (SMA) at ¥183.04.


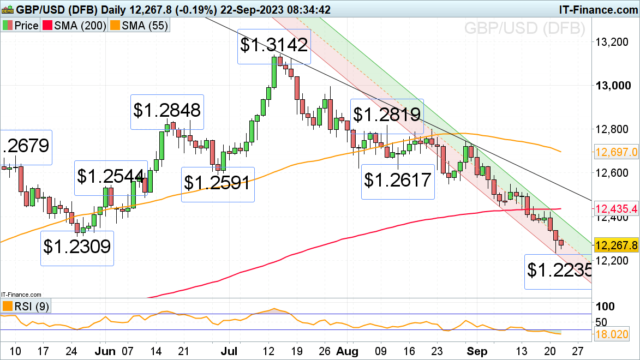
GBP/USD Continues to Trade at Six-Month Lows
After the BOE’s decision to keep rates steady at 5.25%, the British pound extended its decline against the US dollar, reaching a six-month low.
A breach of Thursday’s $1.2235 low could target the mid-March high and the 24 March low, ranging from $1.2004 to $1.2191.
Minor resistance is now situated at the $1.2309 May low, with more significant resistance found along the 200-day simple moving average (SMA) at $1.2435. The bearish trend remains dominant as long as prices stay below this level.


Disclaimer: The above analysis is for informational purposes only and should not be considered financial advice.


